Before You Interpret a Weather Map: Check the Time, Source, and Product
Before you read a colour, line, or symbol on a weather map, write down three things: **the time**, **the source**, and **the product**. Those checks tell you whether the image is an observation, an analysis, a
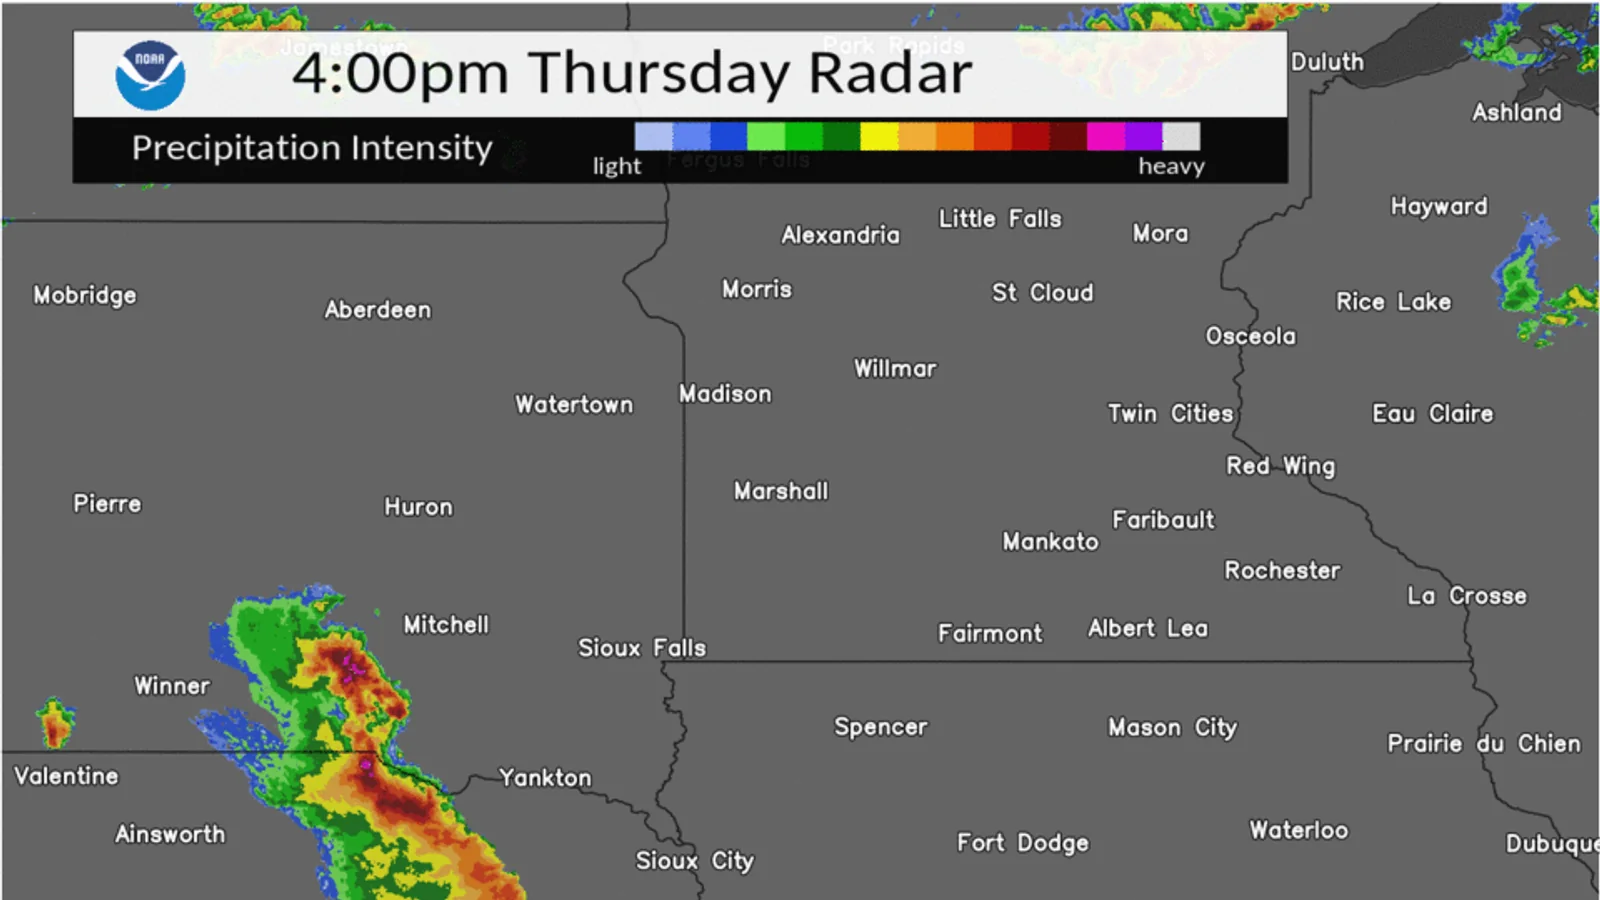
Before you read a colour, line, or symbol on a weather map, write down three things: the time, the source, and the product. Those checks tell you whether the image is an observation, an analysis, a forecast, or a layer derived from one of them. If one field is missing, narrow your note instead of filling the gap with a guess.
1. Check which time the map represents
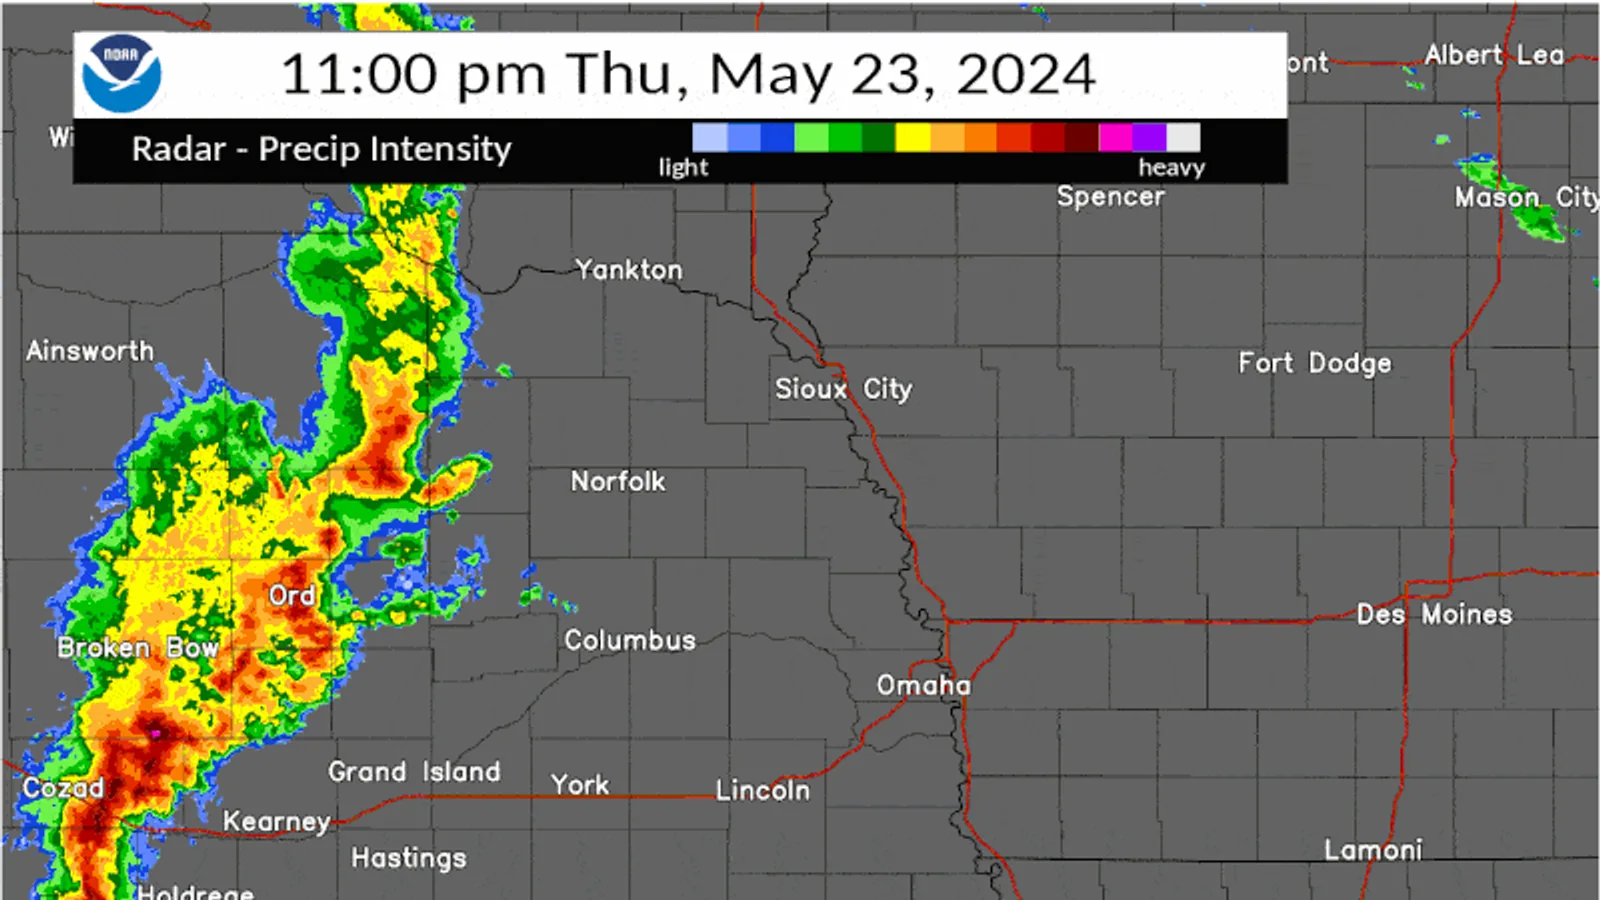
“2 p.m.” can mean several different moments. A frame may have an observation time, a forecast-valid time, an issue time, or only the time when someone took a screenshot. Keep those possibilities separate.
The Met Office latest-observations guide ties observations to observing sites and times. Its map view lets a reader choose the time for which an observation is valid. A surface-pressure page can show both an analysis chart and forecast charts, and it publishes UTC issue information. The time printed beside an image is therefore part of the product description, not decoration.
Use a small time record:
| Field | Example |
|---|---|
| Original time | 14:00 UTC |
| Local conversion | 22:00 in a UTC+8 zone |
| Time type | Frame time; valid/issue meaning not shown |
| Confidence | Medium; original page still available |
Keep the original UTC value even when you add a local conversion. For a reader in a UTC+8 zone, 14:00 UTC corresponds to 22:00 local. That arithmetic does not tell you whether the map shows a past observation or a future forecast. If the time zone is absent, write “zone not shown” rather than silently converting it.
2. Check who supplied the map and where the data came from
A reposted image can lose its legend, timestamp, source, and product name. Look for the provider, the original page, and the data family. “Weather map” is not a source; it is a broad description.
The Met Office global map guide names different data sources and separates model layers from observed radar and satellite layers. Its page also lists the available map products, such as pressure, cloud, temperature, wind, and visibility layers. Record the page or service that supplied the image, not only the account that shared it.
For a screenshot, preserve as much of this as you can:
- provider or agency name;
- original page or map-service address;
- product or layer name;
- frame or issue time and time zone;
- geographic coverage and legend status;
- whether the image was observed, analysed, forecast, or model-derived.
If the image has been cropped, say so. A cropped map may hide the legend or the edge of the coverage area. That does not make it useless, but it changes what you can safely claim about it.
3. Check what kind of product it is
The product label answers a different question from the provider label. A forecast model is not the same thing as an observation. An analysis chart describes an analysed or observed state; a forecast chart describes a future valid time. A derived layer may be calculated from observations or model output.
The Met Office guide says its model layers are forecasts, while its radar and satellite layers show observed conditions from the past. Its surface-pressure page labels an analysis chart separately from forecast charts and says the analysis shows the observed state of the weather. Use that distinction before interpreting a feature.
| Product label | What your note can say | What it cannot say by itself |
|---|---|---|
| Observation | The product displayed an observed condition for a stated time and area. | That the same condition exists at your exact address. |
| Analysis | The analysis represented the assessed state at its analysis time. | That it is a direct instrument reading from your yard. |
| Forecast | The product showed a forecast for a stated future-valid time. | That the forecast will occur exactly as drawn. |
| Derived/model layer | The layer represented a calculated field or model output. | That the colour is a direct observation. |
Do not begin with the most dramatic feature. Begin with the label that tells you what kind of evidence you are looking at.
Repair an ambiguous map caption
Here is a deliberately weak caption:
> Before: “Weather map, 2 p.m. Rain moving in.”
It does not identify the provider, the product, the time zone, the area, or whether “moving in” is an observation or an interpretation.
Here is a more useful version:
> After: “Met Office surface-pressure analysis for the Europe/North Atlantic view. The page labels this as an analysis chart, not a forecast. Issue information and the chart time were copied in UTC; the coverage and isobar legend were checked. This note describes the displayed map and does not establish rain at my location.”
The repaired caption is not longer for its own sake. Each added field answers a different provenance question. If you do not know the chart time, write “time not shown.” If you do not know whether a screenshot is an analysis or forecast, write “product type not verified.”
What to do when a field is missing
Use the missing field to set the limit of the note:
- Time missing: describe the visible pattern without calling it current.
- Source missing: keep the image as an unattributed visual reference, not evidence for a factual claim.
- Product missing: do not call it an observation, forecast, or analysis.
- Coverage missing: avoid saying the feature includes your location.
- Legend missing: describe shape or position only; do not assign a physical meaning to a colour.
This is also where you stop. A map with unknown provenance may still prompt a better question, but it should not be used to create a precise local observation or warning.
When the caption is ready for interpretation
Once the time, source, and product are recorded, you can move to the article that owns the feature you want to read. Use How to Read a Basic Weather Radar for radar reflectivity, How to Read a Basic Weather Satellite Image for satellite channels, and Weather Observation vs Weather Prediction for the boundary between a personal note and an official forecast or warning.
The durable habit is simple: label first, interpret second. A complete caption makes an image checkable later, even when the map page changes or the screenshot is separated from its original context.