
How to Read a Basic Weather Radar
Read a weather-radar image in this order: identify the product, check its timestamp, locate the area, read the scale, then compare several frames. A coloured echo is evidence of returned radar energy, not a dir
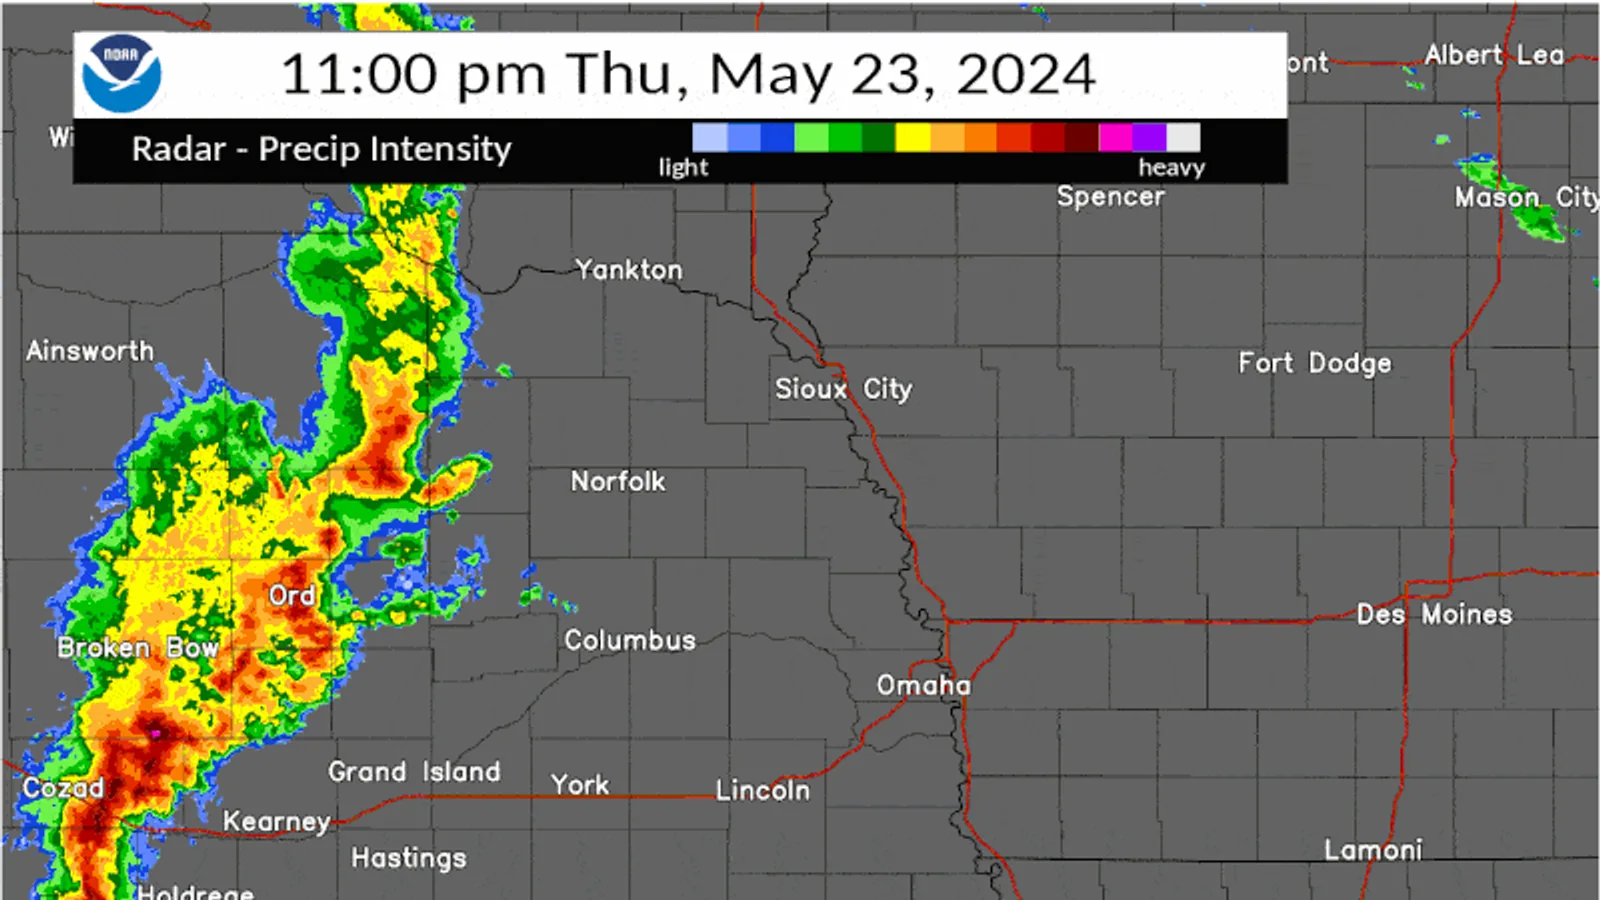
Read a weather-radar image in this order: identify the product, check its timestamp, locate the area, read the scale, then compare several frames. A coloured echo is evidence of returned radar energy, not a direct measurement of rainfall at your home and not a warning by itself.
Identify the product
The most common beginner image is reflectivity. NOAA explains that reflectivity measures returned power from targets; images use dBZ to show it. Higher reflectivity often accompanies stronger precipitation, but radar does not directly measure rainfall intensity. Drop size, particle type, beam height and processing all matter.
Do not confuse reflectivity with velocity, rainfall estimates, lightning, or an official alert layer. Read the title, legend and provider before interpreting colours.
Check time before colour
Find the displayed time zone and whether the image is current, delayed, or an animation frame. A striking image from thirty minutes ago may no longer describe the sky above you. In an animation, ask only modest questions: did an echo move, grow, weaken, or remain nearly stationary? Avoid declaring where it will be at a precise future time.
Read the scale and location
Match colours to the legend on that product, not to a memory from another site. Locate the radar, your approximate area, and any range rings or map labels. Radar samples the atmosphere along a beam, so what it detects aloft may differ from what reaches the ground. A weak echo can still matter, and a strong-looking echo does not prove a particular rain total at one address.
Look also for the product source and coverage. A national mosaic combines information differently from a single local radar. At increasing distance from a radar, the beam samples progressively higher parts of the atmosphere. Mountains, buildings, insects, ground clutter, or unusual propagation can also affect what is displayed. You do not need to diagnose those effects to be a careful reader; simply avoid treating every coloured pixel as a confirmed drop of rain at ground level.
Compare animation, not a single dramatic frame
One frame answers “what did this product show at this time?” An animation can add a limited answer about recent movement. Use at least three frames. Note their times, then describe only the visible trend: “the echo band moved eastward,” “a cell appeared to weaken,” or “a patch persisted near the same map position.”
Do not extend a short animation into a precise arrival time. Storms can develop, decay, split, merge, or move differently from their previous motion. The NCEI radar documentation also distinguishes base data quantities and algorithm-produced products; a radar page may contain more than one kind of information even when its colours look similar.
Confirm conditions at ground level
If it is safe to do so, compare the map with an observation rather than a guess. Look outside: is rain reaching the ground, is visibility reduced, or is there no precipitation at your site? A documented rain gauge can later answer how much collected over its own stated period. These are separate observations, so write them separately.
For example: “Radar reflectivity echo crossed map marker at 15:20. At 15:25, light rain observed at garden; gauge total will be read at 07:30 next day.” This wording does not claim that radar measured the rain rate or that the gauge validates every pixel. It connects two different kinds of evidence honestly.
If your ground observation differs, preserve that result too: “Echo overhead on map at 15:20; no precipitation observed at exposed doorway at 15:25.” Check the timestamp, location marker, and product type before drawing a conclusion. A discrepancy is a prompt to inspect context, not evidence that radar or the observer is automatically wrong.
Recognize product limits without becoming a forecaster
Reflectivity is useful because it helps show where returned energy was detected and how that pattern changes. It cannot by itself identify every precipitation type, prove a surface accumulation, or tell you whether a hazard will affect a particular route. The NOAA reflectivity guide explicitly explains that reflectivity is returned power and that rainfall intensity is not measured directly.
Use official warnings, forecast discussions, and local authority instructions for decisions involving lightning, flooding, severe storms, travel, or outdoor safety. A basic radar-reading article should make a reader more careful about maps, not more confident about issuing personal warnings.
Work through one frame sequence
At 15:00, a green-and-yellow echo is west of your location. At 15:10, it is closer; at 15:20, part of the echo passes over the map marker. A disciplined note is: “Reflectivity echo approached from west between 15:00 and 15:20; colours interpreted using this product’s legend; ground precipitation not confirmed by radar alone.” Then look outside or check a documented gauge if safe.
The unsupported version is: “Yellow means it will rain heavily here at 15:25.” It turns one product into a personal forecast and ignores timing, beam sampling, and uncertainty.
Use a repeatable reading checklist
Before writing an interpretation, pause for a short checklist:
- What is the exact product name: reflectivity, velocity, estimated precipitation, or something else?
- What time is printed on the frame, and which time zone does it use?
- Is the map a local radar view or a composite/mosaic?
- Where is the location marker relative to the echo, and is the map sufficiently zoomed?
- What does the legend say the colours or dBZ values mean?
- What can be confirmed at ground level, and what remains unknown?
The checklist is deliberately shorter than a meteorological analysis. Its purpose is to stop a reader from skipping the product label and timestamp because a colour looks dramatic. A written answer to “unknown” is often the correct outcome. If the frame does not show whether an echo is rain, snow, hail, insects, or clutter, do not supply the missing certainty from imagination.
Keep a map-reading note separate from a forecast note
Suppose a radar animation shows a broken line of echoes approaching a city. Your map note can say: “At 17:05 local time, a broken reflectivity line lay west of the marker and had moved east in the previous three frames.” A separate forecast note can say: “Official forecast checked at 17:08; source and valid period recorded.” A third line can record ground conditions at 17:15.
Separating those lines prevents a common error: quietly transforming an observation of recent radar motion into a statement about the next hour. It also makes correction possible. If the line weakens or misses the marker, the original map note remains accurate; only an unsupported forecast would have failed.
Know when to stop interpreting
Stop the exercise and use official information when the question becomes safety-critical. Do not use a beginner reflectivity reading to decide whether to drive through flooding, remain outside during lightning, assess a storm’s severity, or issue a message to others. The right response to an official warning is to read and follow that warning, not to debate its colour pattern on a map.
For ordinary learning, finish with a bounded result: product, time, observed echo pattern, ground observation if available, and one limitation. That record is enough to make the next radar image easier to read without claiming more than the product can show.
Use radar with the right boundary
Radar is excellent for situational awareness, but official warnings carry the authority and action context for hazardous weather. If a warning, thunder, flooding, or severe conditions are relevant, follow local official information rather than trying to diagnose danger from colour patterns.
Your useful beginner record is therefore simple: product name, image time, observed echo change, your location context, and what was actually observed at ground level. That separates a map reading from a verified local measurement.